
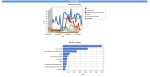
Just out of interest, I’ve taken a comparison of the key indicators from before and after Googlemap’s addition into the header of my blog for the New Zealand blog.
The effects highlighted on the scan.
The main indicators are Time and length of session, also, depth of session, all of which are showing good increases.
The main entry point for the site is the Netherlands blog. From Amsterdam, mostly, it’s popularity stemming from the drugs and sex references in blogs and pictures such as the sex museum and the Hash museum etc.
Also another popular entry point was the Nessie blog complete with picture of Nessie which used to come up 1 or two on googleimages.
Considering the header is only present on the main blog, and I have these blogs, and another 3 blog main pages on this site for which it is not included, these stats have further to go..
Related Reading

60+ mysterious deaths of high powered bankers from 2008 - 2024

Yeah! Just because you live on a narrowboat doesn’t mean you can’t buy Bitcoin! Hell no…… Not wanting to be boring or obvious, but things...

In the 1990’s, a political scientist named Stanley Feldman developed a set of four very simple questions to related to parenting to test the level...
Background So, I’ve been running this site for around 1 month now without hitches, the homepage sorted and the page structure hieracy as it should...

I flew from Jakarta. It was the simplest option in terms of time and cost. The trains that run to the east of Java have...